BUSINESS & DATA ANALYSIS
Turn scattered business data into answers you can actually use.
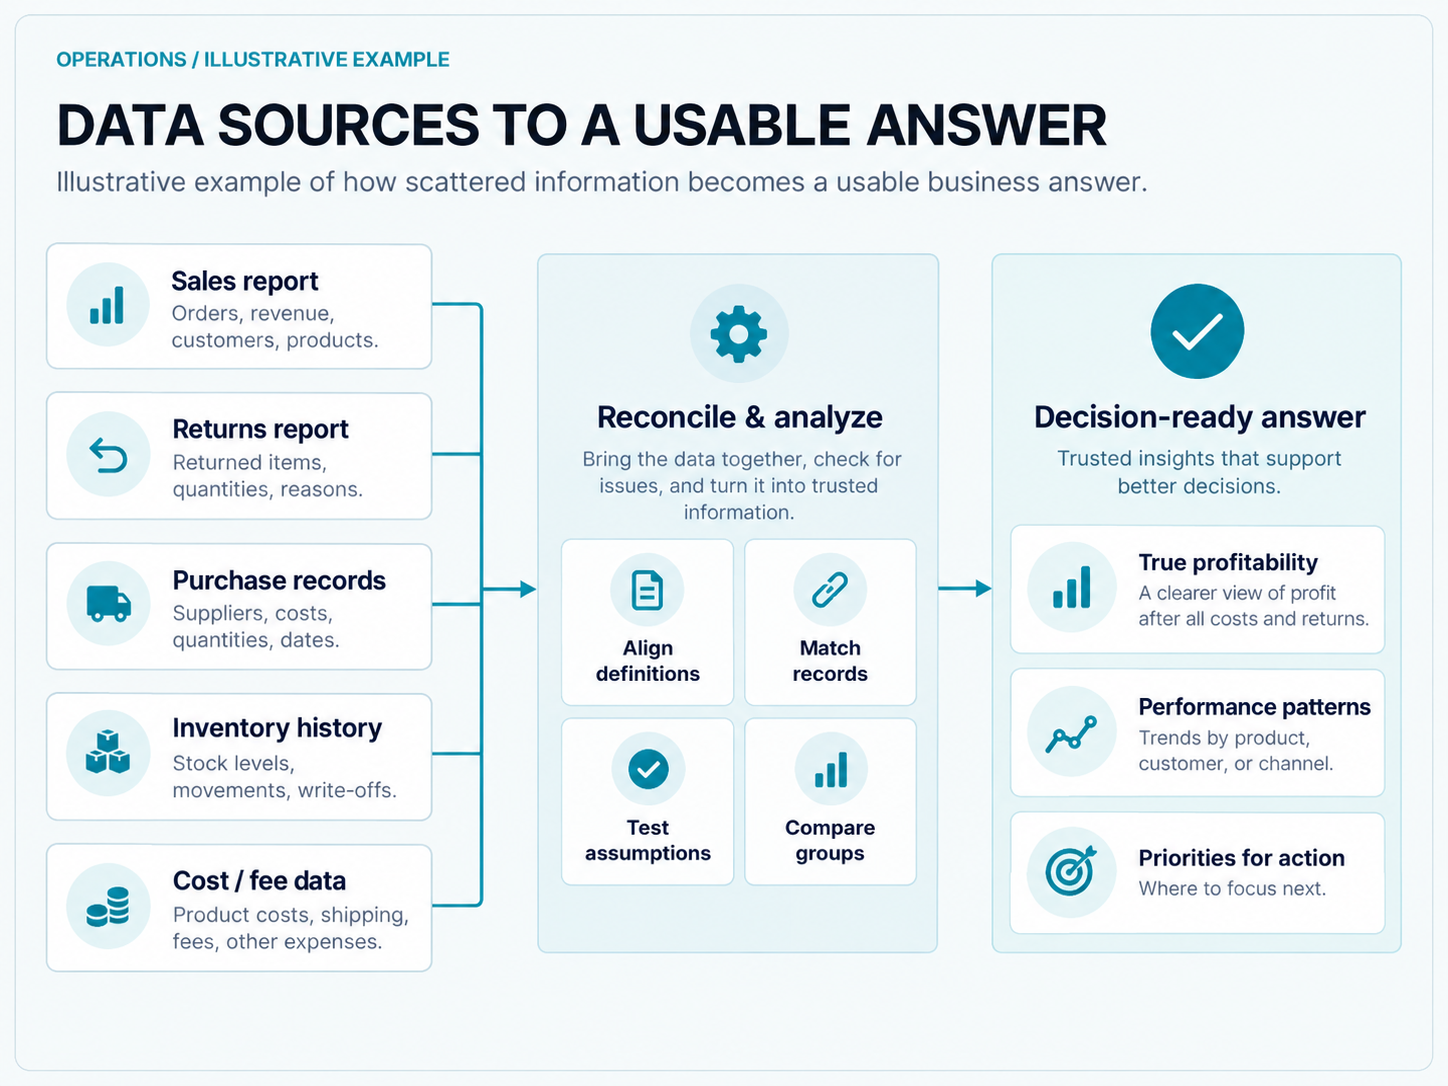
Most growing businesses have plenty of data. The harder problem is that it lives in different systems, uses different definitions, and rarely answers the question management is actually asking.
This analysis connects operational and financial information, tests assumptions, and follows the numbers far enough to explain what is happening and why.
The goal is clearer decisions, supported by evidence you can trace and understand.
Useful when the data exists, but the answer is buried across reports, spreadsheets, systems, or conflicting definitions.
WHAT GETS ANALYZED
Start with the question, then build the evidence.
The work is organized around the decision you need to make and the uncertainty you need resolved.
01
Profitability & contribution
Connect revenue, direct costs, operational costs, returns, fees, and other relevant inputs to understand where economic value is actually being created or lost.
02
Performance patterns
Compare products, brands, categories, suppliers, teams, periods, or other meaningful groups to see where strong and weak results are concentrated.
03
Data reconciliation
Bring together reports and records that use different structures, identifiers, or definitions so the same business event can be followed across multiple sources.
04
Assumption testing
Test the numbers management currently relies on—cost estimates, recovery assumptions, thresholds, averages, or rules of thumb—against the available evidence.
05
Root-cause analysis
Go beyond identifying that a number changed and trace the operational, financial, or process factors most likely to explain why the result moved.
06
Decision support
Translate the analysis into the business question it was meant to answer: what deserves attention, what should change, and what still cannot be concluded confidently.
THE BUSINESS CONSEQUENCE
Having the data is different from having the answer.
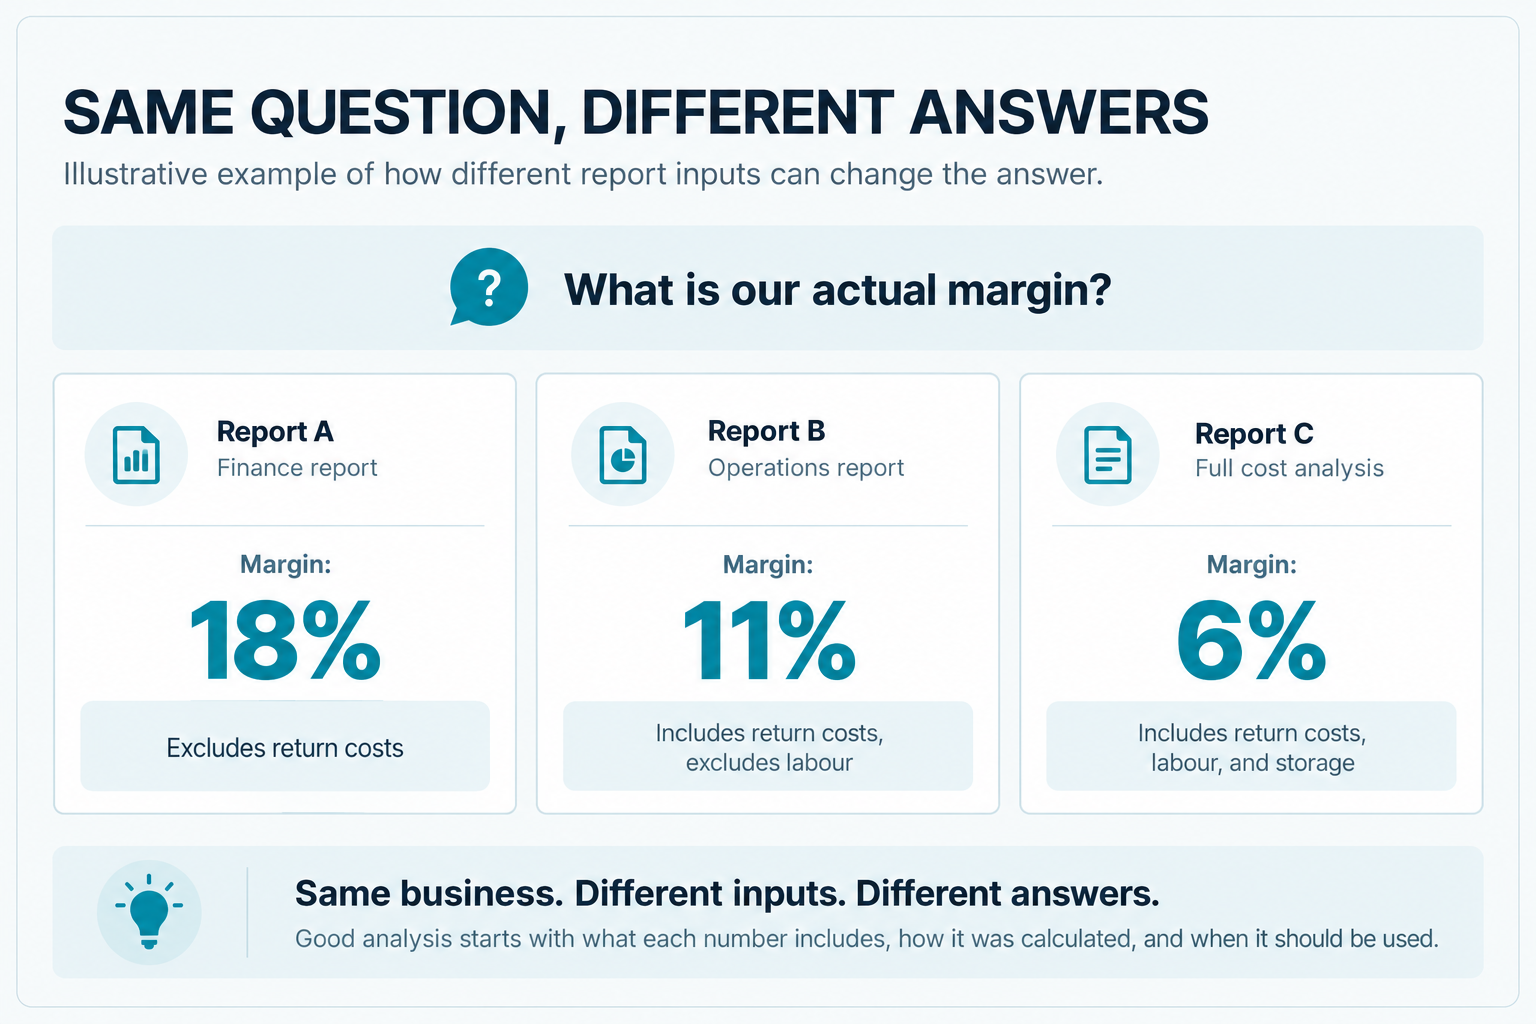
A dashboard can show that a number moved. A spreadsheet can calculate a margin. Neither automatically tells you whether the inputs are complete, whether two reports describe the same population, or which operational decisions created the result.
As a business grows, definitions drift, spreadsheets multiply, and different teams start measuring the same thing in different ways. Good analysis reconnects those pieces before management acts on a number that may be incomplete or misunderstood.
- Which numbers can management rely on, and which depend on weak assumptions?
- Do different reports describe the same population, period, and business event?
- What explains the gap between the headline result and the underlying economics?
- Where are averages hiding important differences by product, category, supplier, or process?
- What can the evidence support confidently, and where is uncertainty still material?
WHAT YOU RECEIVE
Clear conclusions with evidence you can inspect.
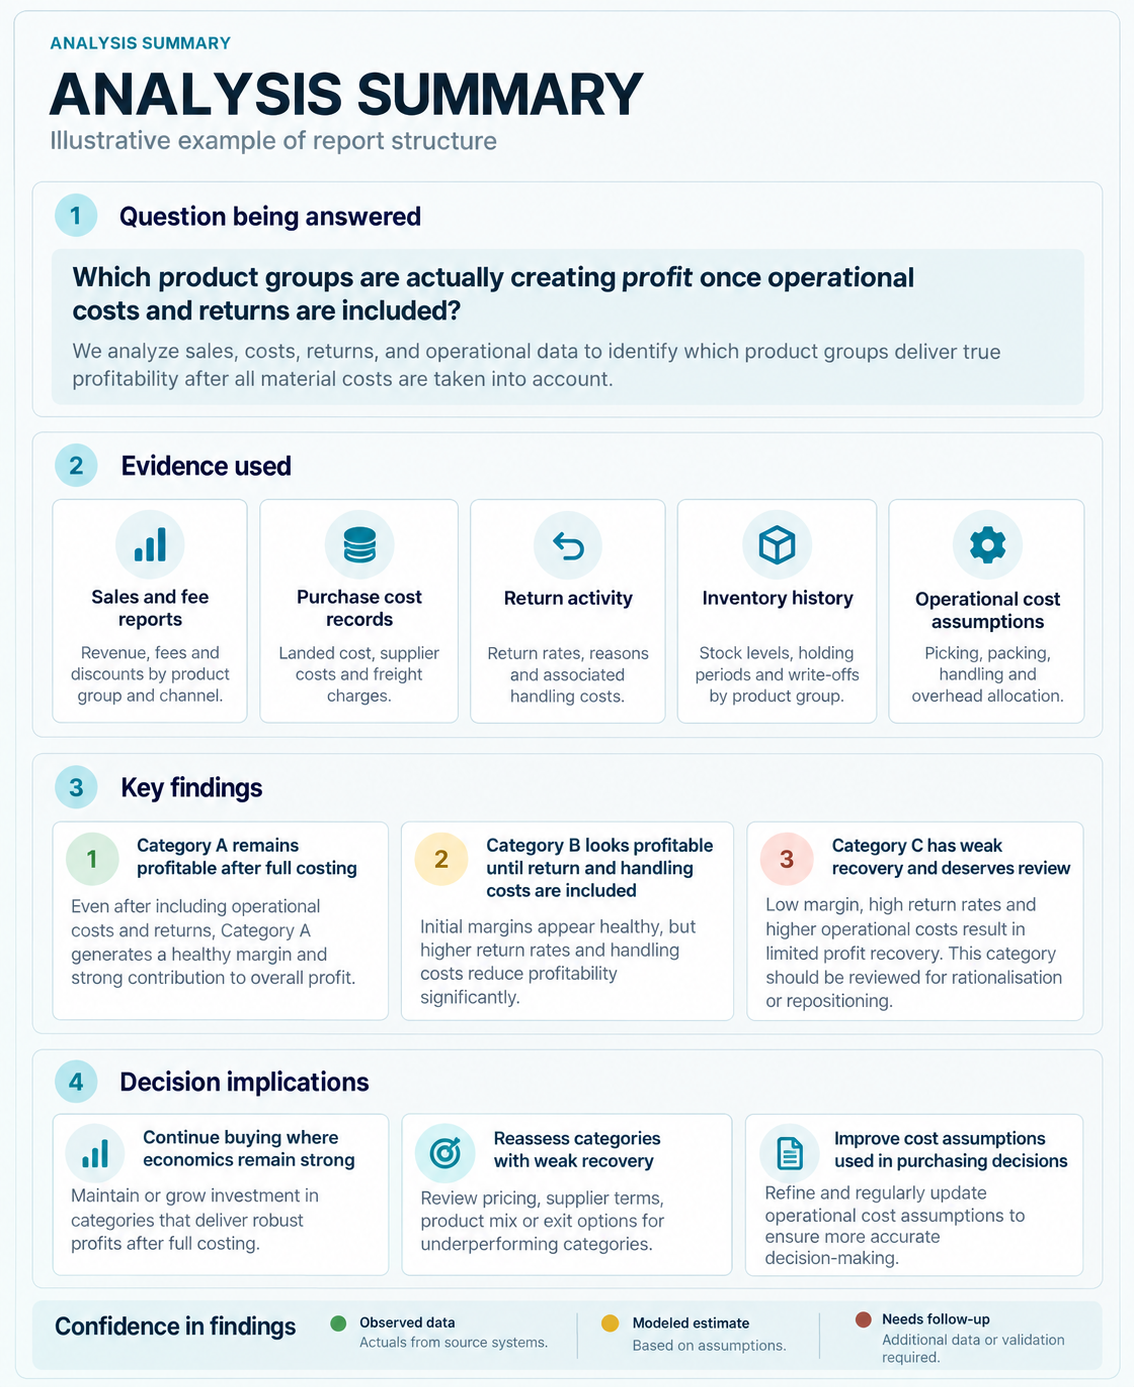
The output is built so management can understand the conclusion, inspect the evidence behind it, and distinguish measured facts from estimates, assumptions, and unresolved gaps.
01
Written findings
A clear explanation of what the analysis shows, what it does not show, and which findings materially affect the business question being investigated.
02
Supporting analysis
Structured spreadsheets, calculations, reconciliations, or other analytical work that supports the conclusions and allows important results to be traced back to their inputs.
03
Decision priorities
A focused view of which findings deserve action, which assumptions should be changed, and which unanswered questions require better data before a decision is made.
04
Walkthrough
A final meeting to explain the logic, answer questions, challenge interpretations, and make sure the people using the analysis understand what the evidence actually supports.
HOW IT WORKS
Build the analysis around your next decision.
The analysis starts by defining the business question clearly, then works backward to determine which data, definitions, and comparisons are required to answer it responsibly.
01
Define the question
Clarify what management is trying to understand, which decision depends on the answer, and what would count as useful evidence.
02
Gather & reconcile
Collect the relevant reports, spreadsheets, operational records, and definitions, then resolve mismatches that would otherwise make comparisons unreliable.
03
Analyze & test
Build the analysis, test assumptions, compare meaningful groups, and follow unexpected results until the available evidence supports a reasonable explanation.
04
Explain & prioritize
Present the findings in business language, separate strong conclusions from uncertainty, and identify the decisions or follow-up work that matter most.
Where the available data cannot support a confident conclusion, the findings explain the limitation and what additional information is needed.
BEST FIT
Best for businesses with data but limited visibility.
This service is most useful when management can see that the information exists somewhere in the business, but cannot turn it into a reliable answer without substantial analysis and reconciliation.
A strong fit when…
- Important questions require information from multiple reports, systems, or spreadsheets.
- Different teams use different definitions or calculate the same metric differently.
- Management has numbers but does not trust the assumptions behind them.
- Averages or headline metrics are hiding meaningful variation underneath.
- A decision is important enough that guesswork and surface-level reporting are no longer sufficient.
Scope & boundaries
This is business analysis and decision support, not bookkeeping, tax work, statutory audit, or ongoing financial reporting. The engagement is scoped around a defined business question and the evidence required to answer it well.
The work can stand alone or support a broader operational, sourcing, or Amazon analysis when the underlying question crosses multiple parts of the business.
WHAT DEEPER ANALYSIS CAN REVEAL
The headline number is often only the beginning.
These examples come from prior analytical work. Details are generalized or anonymized where appropriate, and modeled findings are described as modeled rather than observed fact.
26K+
Return records
A large return population became usable evidence.
More than 26,000 return records were classified into meaningful outcome groups, turning a difficult raw-data population into something that could support return, recovery, and sourcing analysis.
62.7%
Observed success
Recovery performance became measurable.
A Grade & Resell population was reconciled to an observed 62.7% success rate, separating successful outcomes from assumptions and providing a stronger basis for estimating inventory recovery.
91.9d
Days to sell
Inventory speed gained a real baseline.
Analysis established an average of 91.9 days to sell, creating a measurable reference point for inventory age, storage exposure, purchasing behaviour, and future intervention rules.
Profit→Loss
Conclusion changed
Adding missing costs changed the answer.
In one business analysis, incorporating fixed expenses changed the overall conclusion from profitable to negative. The underlying sales had not changed; the completeness of the economic model had.
COMMON QUESTIONS
The details people usually want to know.
The exact data request depends on the question being answered, but these are the issues that usually matter before an analysis begins.
What kinds of business questions can you analyze?
Questions involving profitability, cost, performance, returns, inventory, purchasing, operational efficiency, category or product comparisons, and other areas where the answer depends on combining business context with data. The scope is defined before the work begins.
Do we need clean data first?
No. Data quality problems are common and can themselves explain why management lacks visibility. The analysis will distinguish usable evidence from unreliable or incomplete information and will state clearly where the data limits the conclusion.
Can you work across multiple data sources?
Yes. Much of the value comes from reconciling information that lives in different reports, spreadsheets, exports, or internal systems. The sources still need enough common structure or business context to be connected responsibly.
Is this the same as business intelligence?
No. A BI system is primarily a reporting and visualization environment. This service is a defined analytical engagement focused on answering a business question, testing assumptions, interpreting the result, and explaining what management should take from it.
Will you build permanent dashboards for us?
Not as the standard engagement. The focus is analysis and decision support. If a finding shows that a recurring metric or reporting process should be formalized, that can be recommended and potentially scoped separately.
What happens if the data cannot answer the question?
You will be told exactly that. A useful analysis sometimes establishes that the current evidence is insufficient, identifies what is missing, and shows what would need to be measured or collected before the business can answer the question confidently.
START WITH THE QUESTION
What decision are you making without a clear enough answer?
If the information exists but remains scattered, inconsistent, or difficult to interpret, start with the business question. From there, we can determine whether the available evidence can answer it—and what it would take to do so well.
Bring the question, the uncertainty, and whatever information you already have. The analysis starts from there.